The Most Popular SaaS Website CTA’s: Analysis of 5k+ CTAs

Two years ago, we analyzed 5625 B2B SaaS CTAs to see what were the most popular or fastest-growing CTAs.
This year, we analyzed a similar data set (5495 B2B SaaS websites) to see what trends have grown and changed.
Demos vs Trial CTAs
In 2020, roughly 41% of B2B SaaS websites had a demo-based call to action (CTA).
47% of sites had assorted CTAs non-specific to trials or demos, such as “contact us,” “get in touch,” or “request information.” The remaining 12% of CTAs were related to a free trial.
In 2022, a similar pattern emerged. Again, around 40% of sites had a demo-based CTA. But this year, only 45% had non-trial or demo-based CTAs, slightly lower than in 2020.
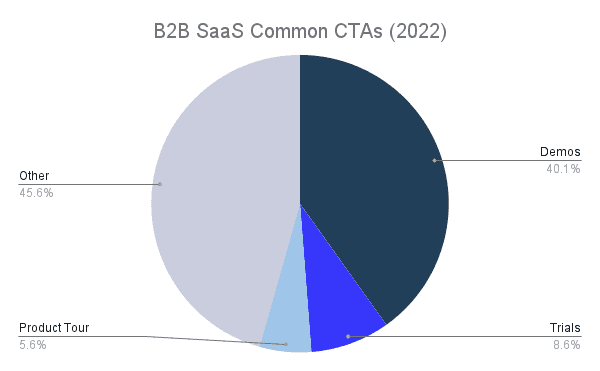
There was also a decrease in free trial CTAs, only 8.65% had free trial-focused CTAs. The remaining CTAs were related to Product Tours or were non demo or trial related.
Key Takeaways
- Demos continue to be the dominant CTA for SaaS websites
- Other CTA types still made up the highest category but dropped compared to last year
- Trial-based CTAs dropped by 3.55%
We theorize that part of the drop in trial-based CTAs came from the rise in “Product Tour CTAs” 一 a concept we’ll discuss later in this article.
Free Trial CTAs
Before we explore Product Tour CTAs, let’s take a closer look at the free trial CTA types.
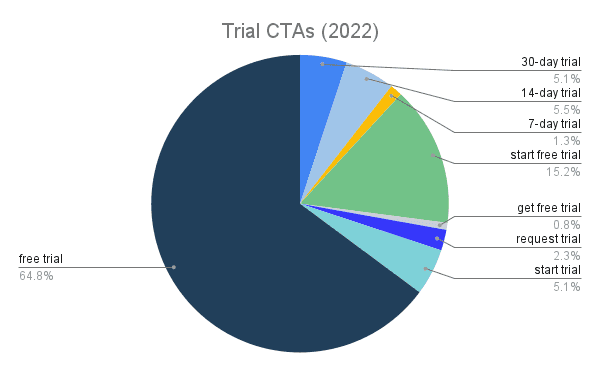
While the percentage dropped slightly, “Free Trial” was still the most common free trial-related CTA (64.85% in 2022 versus 70.4% in 2020).
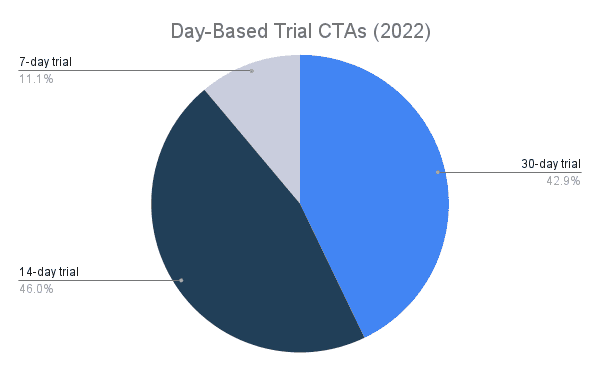
For length of free trial, 14-day free trials are still the most popular time frame at 46.03%. However, this significantly reduced from 72% in 2020, mostly due to a rise in 30-day trials.
In 2020, only 16% of B2B SaaS websites had a 30-day free trial CTA. This year, that number jumped to 42.86%.
Some SaaS companies have discovered that 14 days isn’t enough time to demonstrate ROI, so they expanded it to 30 days.
According to UserPilot, a SaaS in app-experience platform:
“A huge number – around 80% of users will drop out after two days. At the same time, 80% of SaaS conversions happen at the 40-day mark. Our research shows that it is actually the time it takes for users to reach your “Aha Moment!” and to perform key actions that influence conversion rate much more than the free trial length itself.”
There was also a rise in websites having both a demo and free trial CTA. We found that 69.47% of all websites that had the trial CTAs also had a demo CTA in 2022, a 6.07% increase from 2020.
This trend reflects a blending of PLG and traditional sales motions into the new category of Product Led Sales. It also highlights the “choose their own adventure” era for buyers where they decide how they want to interact with your product.
Key Takeaways
- 14 and 30 day free trials are almost at an even split
- Longer free trials are growing in popularity
- Combined free trial and demo CTAs are increasing in popularity
Although the 30-day trial may give companies a chance to make a more outstanding impression on their prospects, the rise in longer free trials ultimately slows the sales process. Free trials that require lengthy set up also put the onus on the user to set up the tool, hook up integrations, and decide if a product is the right fit.
These issues have likely been another contributor to the growth in Product Tour CTAs.
Rise of the Product Tour CTA
Over the past two years, there’s been a massive increase in the product tour and interactive demo space.
In 2020, there were almost no “Product Tour” CTAs. By contrast, 5.61% of B2B SaaS website CTAs had a variation of “Product Tour CTA.”
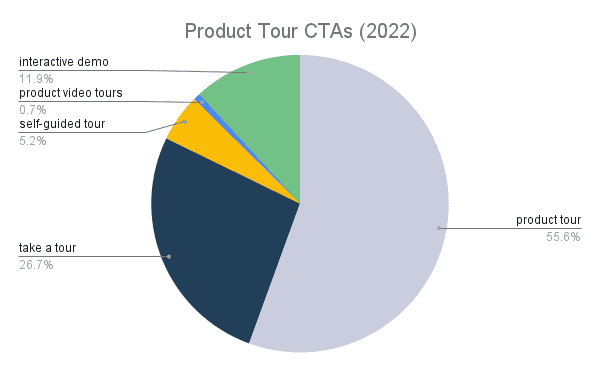
Of the websites with a Product Tour CTA, 55.56% used “Product Tour” as the CTA text. The next most common calls to action were “Take a Tour” and “Interactive Demo.”
Product Tour CTAs are often combined with other CTAs as well. 16.56% of websites with a Product Tour CTA also include a “Free Trial” CTA, and 54.55% also include a “Demo” CTA.
Key Takeaways
- Product tour CTAs significantly increased from 2020
- “Product tour” is the most common CTA text for interactive demos
- Product tours CTAs are often used with demo or free trial CTAs
The data we’ve gathered shows that users are eager to get access to your product and want to get acquainted with it on their own time. As a result, more and more B2B SaaS companies are adopting self-serve interactive product tours, allowing users to walk through the product by themselves at a high level.
CTAs have shifted over the past two years
In all, we’ve learned that demos are still the most prevalent CTA on B2B SaaS websites, but we’re starting to see other patterns surface:
- Demo based CTAs remained about the same from 2020 (around 40%)
- Trial based CTAs are decreasing in popularity (decreased 3.55%)
- Combined free trial and demo CTAs are increasing in popularity (increased 6.07%)
- Product tour CTAs significantly increased from 2020 (increased 5%)
If you’re looking for more insight into how to improve your B2B SaaS website, check out:
Turn demos into deals.
Build interactive product demos that engage buyers and close deals faster.