5 Steps to Increase SaaS Website Conversion Rate

Improving your website conversion rate can feel like a daunting task. One that might require an entire redesign.
But you don’t need to tackle the entire website at once. In fact, the best growth teams tackle one point of the funnel at a time and make small optimizations.
Keep reading to find out how multiple top SaaS companies have lifted their web conversion rates — one small change at a time.
SaaS Website Benchmarks
Before we dive into the how-to, let’s review typical website conversion rates for PLG and sales led companies to give you a better sense of where you stand.
PLG
Openview, a PLG-focused venture capital firm, published a benchmark report earlier this year. In it, they share average website signup rates based on a survey of over 1,000 PLG operators.
The signup metrics varied somewhat significantly between companies that offered a free trial and those that offered a freemium plan:
- Free trial: 5%. While the 25th percentile was 2%, the 75th percentile went up to 15%
- Freemium: 9%, the 25th percentile hovered around 3% and the 75th around 20%
Sales Led
For the sake of this blog post, we’re using “sales led” to describe companies whose CTA is a version of “Book a Demo” rather than a free trial or freemium account.
On the whole, sales led companies have lower website conversion rates. According to the pop-up builder Popupsmart, the average website conversion rate is between 2% and 5%. But there’s a wide variance depending on industry and business type.
For example, for B2B businesses, a conversion rate of 2.23% is at the lowest end of the spectrum. Yet some achieve conversion rates as high as 11.7%.
5 Steps to Optimize Your Website for Conversions
Here are five steps we have taken at Navattic to grow our website conversion rate and tips and results from customers like CaptivateIQ and Trainual.
Step 1: Decide what part of the funnel you want to focus on
Improving your entire funnel can be overwhelming. The key is to find a specific place to improve. Start by analyzing each point of your funnel. Measure the number of:
- Website sessions
- Website engaged sessions
- Website users
- Demo page users / free trial page visitors
- Demos booked / free trial sign-ups
- Opportunities / paid users
Below is an example of what this report would look like
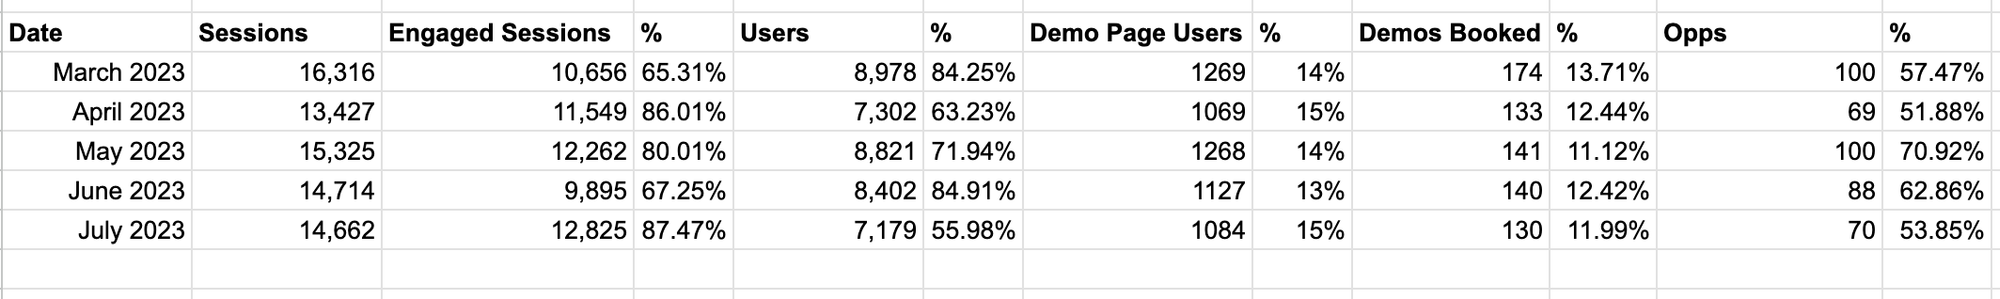
You should be able to find these metrics in your GA4 account and CRM. Then, determine the conversion rates among all those metrics. Finally, use those rates to see where the biggest dropoff points are — those are what you need to handle first. Pick just one of those to kick off your project.
Here’s an example: at Navattic, we noticed a dropoff in the number of people who filled out our form to book a demo. Our hypothesis was that manual routing was discouraging full sign ups. So we used a combination of Clearbit and Chili Piper to eliminate manual routing.
With that one small change, we improved form completion by 10%.
If you need some more inspiration, check out Mutiny’s playbooks. Learn how companies like Pendo, Notion, and Snowflake made small tweaks to their personalization strategy or messaging that dramatically increased their deal flow.
Step 2: Conduct website visitor research
As marketers, we like to look at numbers. But qualitative research can unlock some powerful ideas, too. Use both to your advantage.
Quantitative
Figure out what types of users are most likely to convert. This is easy to do with an analytics platform like Sequel.io, Mixpanel, or Amplitude. Look at:
- Pages they visit
- User traits
- Segmentation
If they all visit a certain page, ask how you can ensure more visitors see that page. And if they make up a distinct part of your ICP, develop strategies to attract more prospects in that segment.
Qualitative
User feedback tools like Wynter can give you excellent feedback. You can test messaging with verified B2B customers in your exact audience.
You can even get specific on their titles, industry, company size, and other relevant attributes. It’s easy to get user feedback on different value propositions, copy, or layouts. Plus, Wynter gets you test results within two days.
At the same time, you can watch the users’ end-to-end journey with an insights tool like Hotjar, VWO or Factors.ai.
Both offer screen recordings of user behavior and show heat maps of where users spend most of their time. You can even send surveys or schedule interviews with customers or prospects to get more granular feedback. With this data, you can hone in on what’s working and what’s not.
Step 3: Come up with a hypothesis based on website visitor research
Next, come up with 3 - 5 hypotheses for how you could resolve the issues you’re having. Be sure to incorporate the qualitative and quantitative feedback you got in Step 2.
For the highest chances of boosting your conversion rates, be sure your hypotheses cover at least one of the main pain points of B2B buyers.
Earlier this year, we partnered with Chili Piper to interview dozens of B2B SaaS professionals about the B2B buying experience. Our B2B Buyer Best Practices Report outlines three of their main grievances:
- It’s too hard to schedule time with the sales team, it takes an average of 2 days to get in touch with someone.
- Websites don’t highlight enough product information. It’s tough to figure out what the product does and how it can help the prospect’s team.
- There is no pricing page, making it impossible to budget for.
Addressing one or more of these potential problems can take your conversion rates from good to great. Here are some real examples of how this played out for our customers.
CaptivateIQ's experiment
As a sales led company, CaptivateIQ hypothesized that showing off their product interface earlier in the funnel would get more prospects interested in engaging with sales.
“Especially if a prospect is currently using spreadsheets or a legacy solution, seeing CaptivateIQ in action for the first time can be very exciting. Since the first engagement with our sales team occurs pretty far down-funnel, we decided to find a way to lead with our product up the funnel on our website.”
They turned out to be right:
“Our Navattic tour now has a higher conversion rate than any other referrer to our request a demo page, at nearly 40%."
Trainual's experiment
Trainual, a PLG company, thought they could get more free trial signups by explaining more about what Trainual does and why it’s important upfront. This was especially challenging because they serve businesses across various industries and verticals.
“We wanted a way to showcase a curated and interactive version of what it feels like to be within our product. The goals were: (1) to get users to the light bulb “a-ha” moment before even starting a trial, and (2) to communicate value earlier in the evaluation process.”
Trainual used Navattic to create an interactive demo introducing prospects to their playbooks and potential ROI to great success:
“We tested our interactive demo against an existing product tour video. After a few weeks, we saw a +450% lift in free trial signups when the interactive demo was displayed.”
Importantly, they also saw a +100% lift in users reaching activated (highly engaged) trial status seven days after signup and a +175% lift in users converting to paid customers in that same timeframe.
Step 4: A/B test new experience vs. old
If you have enough web traffic (10k visitors or more), you should be able to A/B test. Use a tool like Mutiny or Optimizely to measure your results. Both can provide tips for greater personalization, and Mutiny will even use AI to rewrite headlines for you.
If you don’t have that many website visitors, you’ll have to do manual before and after testing. Update the website with your change, then reference the numbers you recorded in Step 1 to confirm whether or not your hypothesis was right.
Keep in mind, that this kind of testing is not as reliable, as there a lot of outside factors like a busy holiday week that could affect results.
Step 5: Run until stat sig, no result, or keep iterating
Continue running your A/B tests until they are statistically significant. Some tools like Mutiny will tell you when this happens so you don’t have to do the math.
If your adjustment works and you hit stat sig, apply it!
If, after a month, your test isn’t statistically significant, consider pausing or iterating on the test. Don’t let your test go on for too long — otherwise, you’re just taking time away from other tests and other pressing marketing activities.
To recap, upping website conversion rates doesn’t have to mean a total website revamp. You can take it one step at a time and use A/B testing to make sure you’re on the right track.
For other ways to boost your SaaS marketing metrics, check out:
Turn demos into deals.
Build interactive product demos that engage buyers and close deals faster.