State of the Interactive Product Demo 2023
We built this report to answer the most common questions we get from customers and prospects. We analyzed over 3,000 demos built on our platform to understand how interactive demos fit into the larger product-led market and how our top-performing customers optimize for conversions.
About this report
Over the past two years, we have seen massive growth in the interactive demo space. With that growth has come plenty of questions about interactive demo best practices and benchmarks.
We built this report to answer the most common questions we get from customers and prospects. We analyzed over 3,000 demos built on our platform to understand how interactive demos fit into the larger product-led market and how our top-performing customers optimize for conversions.
Data overview
Almost all of the companies analyzed were SaaS (software as a service) companies. Most of our data refers to public-facing demos (embedded on a website or linked out to in marketing material).
Any section referring to top-performing demos was pulled from 200+ demos with the highest traffic and engagement metrics across our customers.

Top Interactive Demo Findings
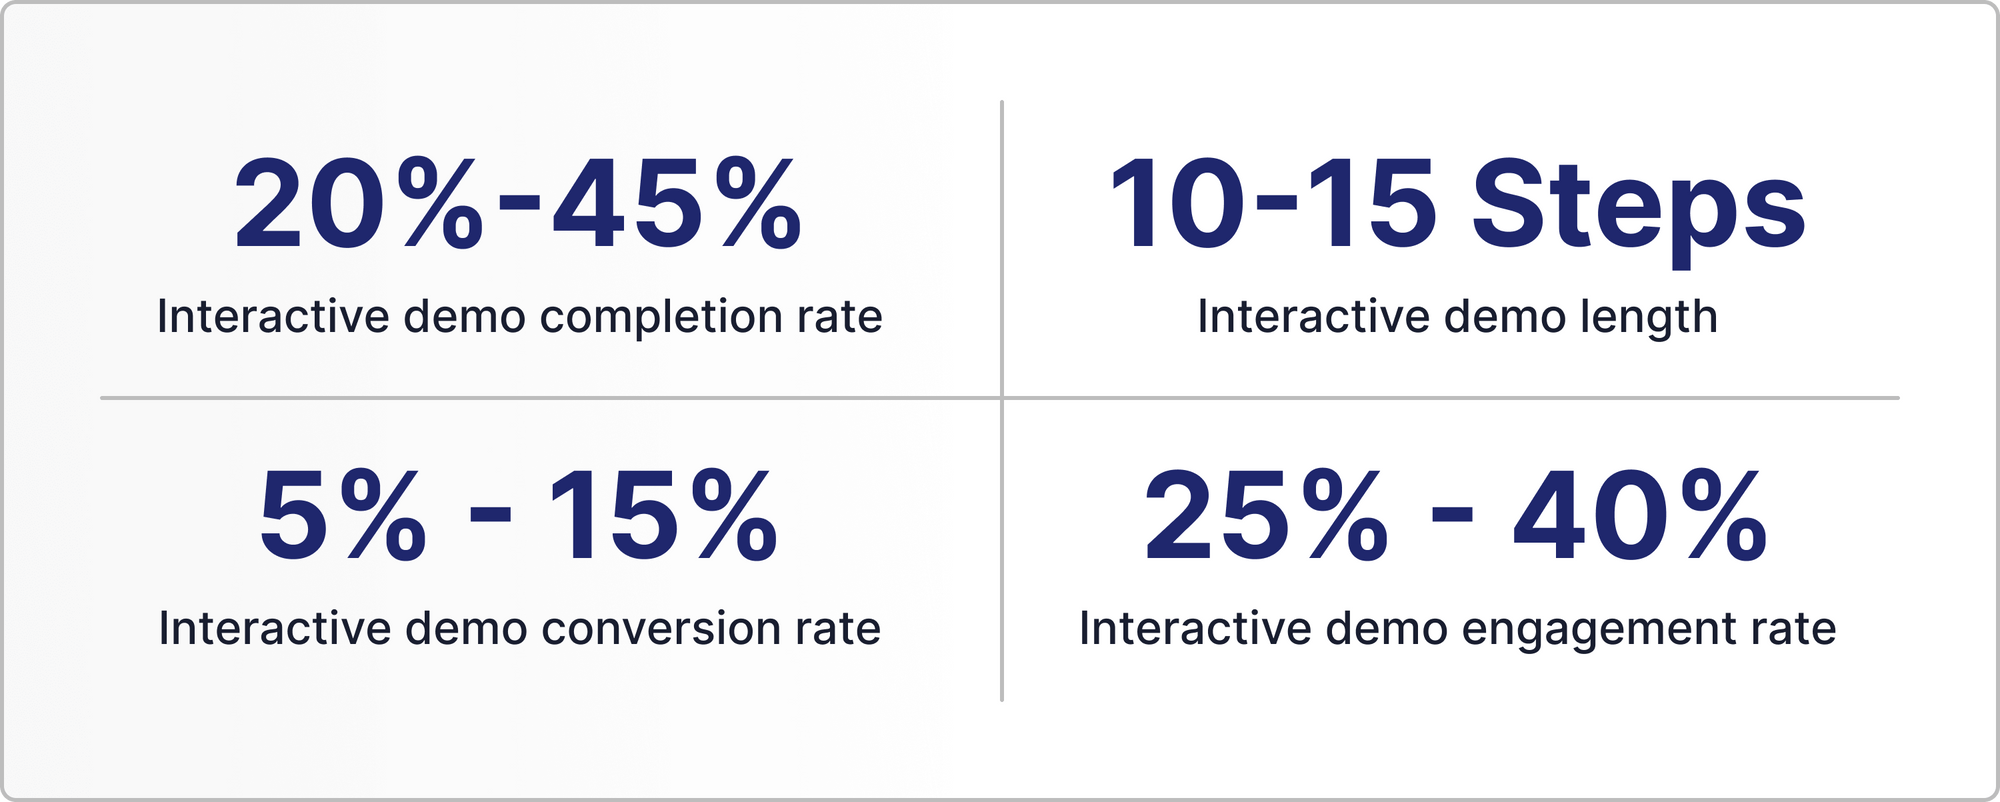
Below is a high-level overview of some of the most requested metrics around interactive demos. These metrics answer:
- What is the average completion rate for interactive demos?
- What is the ideal length for an interactive demo?
- What is the average conversion rate for interactive demos?
- What is the average engagement rate for interactive demos?
A full breakdown of how we collected this data and calculated these stats can be found throughout the report. Definitions for each stat are below:
- Completion rate: Total number of completed demo sessions / total number of started demo sessions
- Demo length: Total number of steps within the first section of a demo
- Conversion rate: Total number of CTA clicks / total number of demo sessions
- Engagement rate: Total number of sessions with a completed step one / total number of sessions on a landing page with an embedded demo
What are Interactive Product Demos
Interactive product demos provide prospects and customers with a hands-on walk-through experience of your product throughout the sales and marketing funnel.
No-code capture software is used to clone your application, to provide an authentic look and feel. If you're looking for examples, we've got you covered. View our interactive demo showcase here.
Interactive demos have grown in popularity for three reasons:


How are Interactive Demos Used
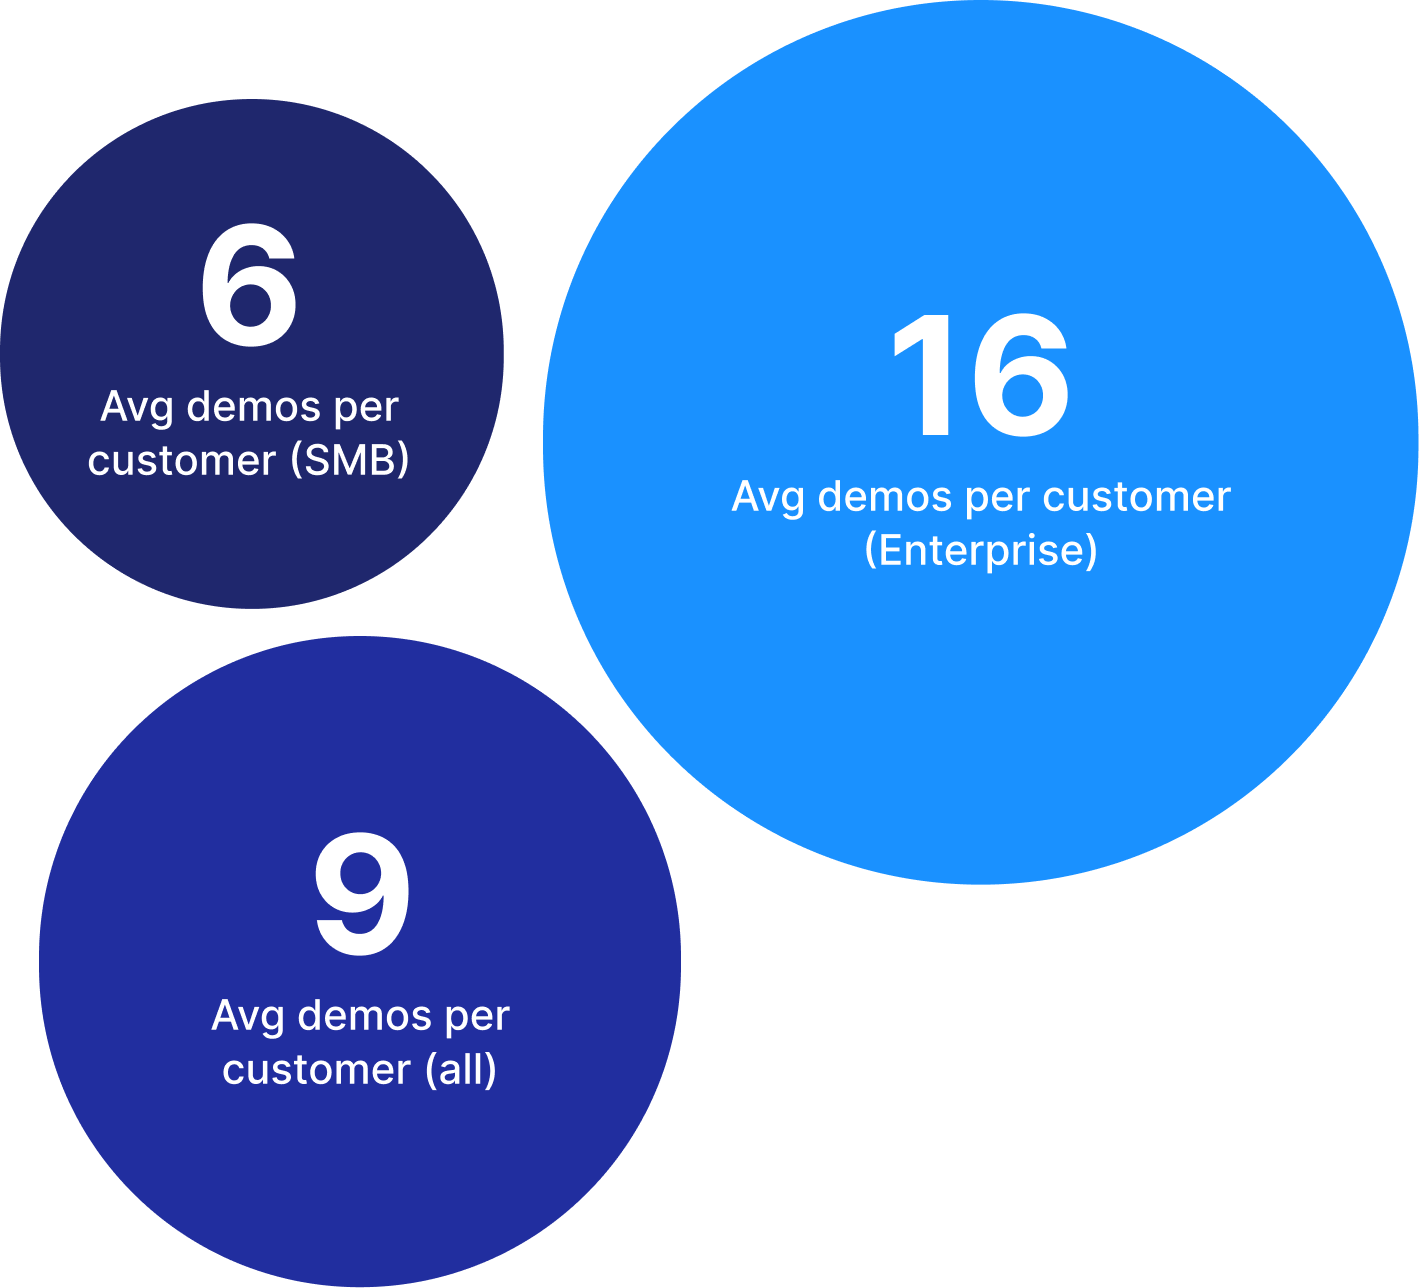
For this section, we analyzed 3000+ customer demos and 5000+ B2B SaaS websites. Our customer demos spanned a variety of different use cases in marketing, sales, and post-sales.
Below are benchmarks around the popularity and adoption of interactive demos.
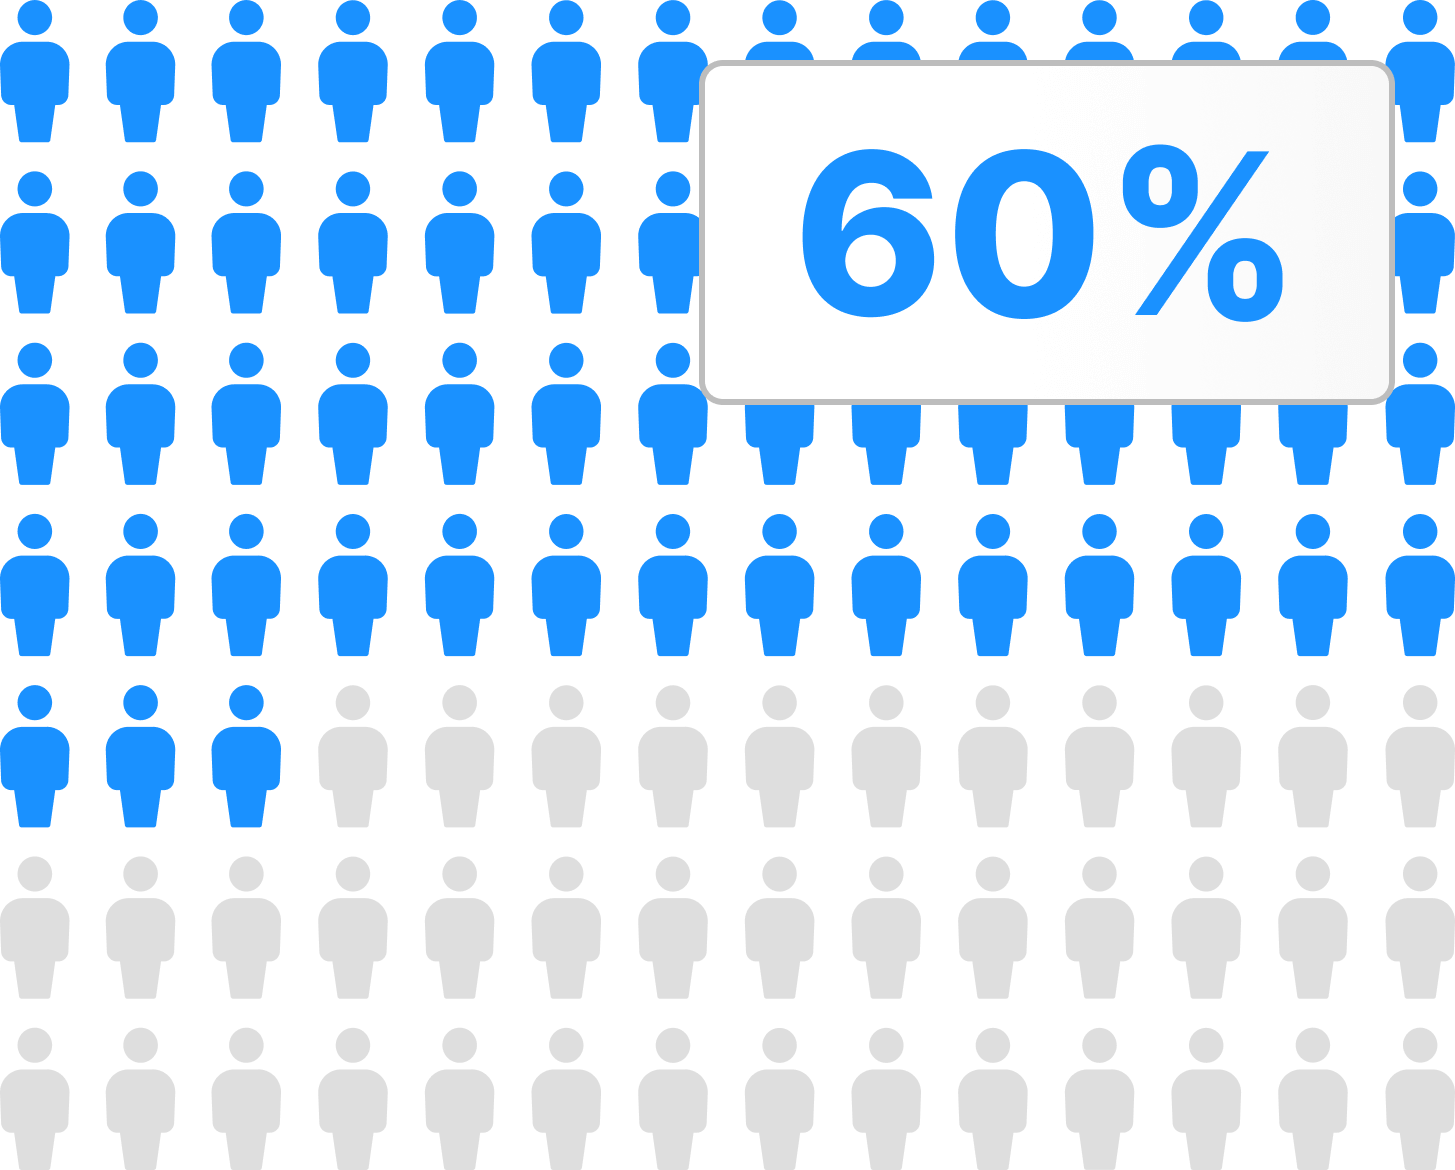
How popular are interactive demos
Demo popularity was measured by adoption from our customers and a sample size of SaaS websites to see how many included an interactive demo.

Where are interactive demos used
Interactive demos can be both public-facing (shared on a website, in a marketing campaign, or at a conference) or private to one prospect during the sales cycle.
For the majority of this report, we focus on public-facing marketing demos.
Public vs private interactive demos
A vast majority of our current customers have a public interactive demo embedded on their website or shared via marketing campaigns.

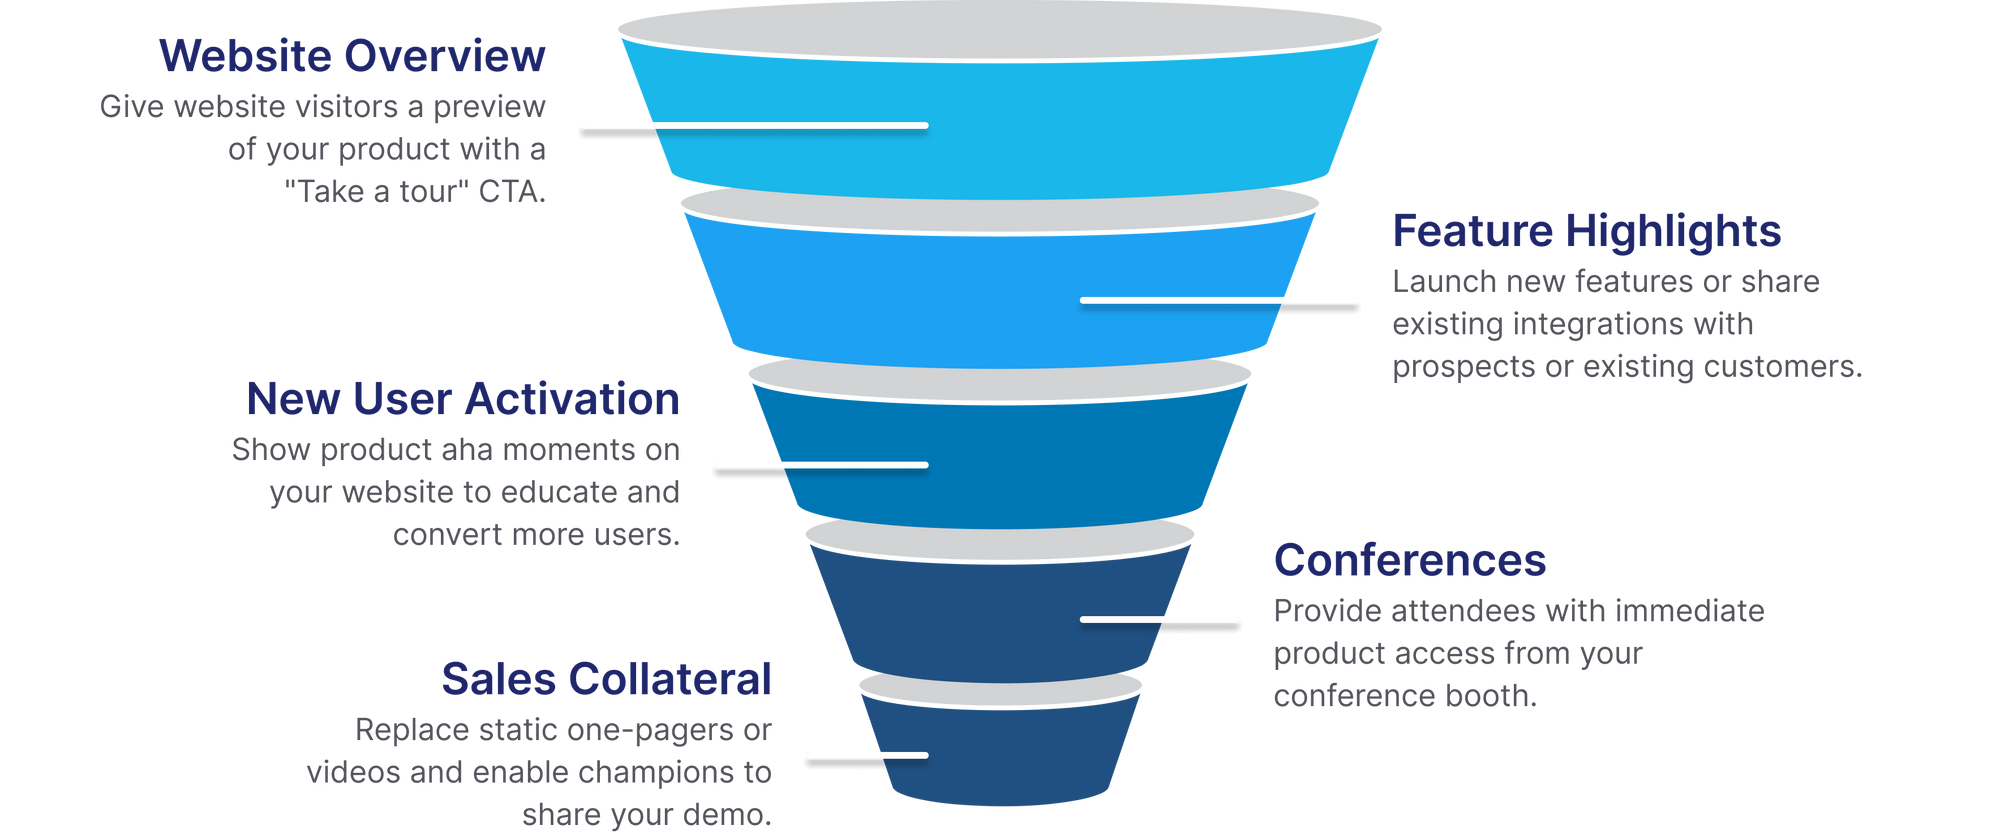
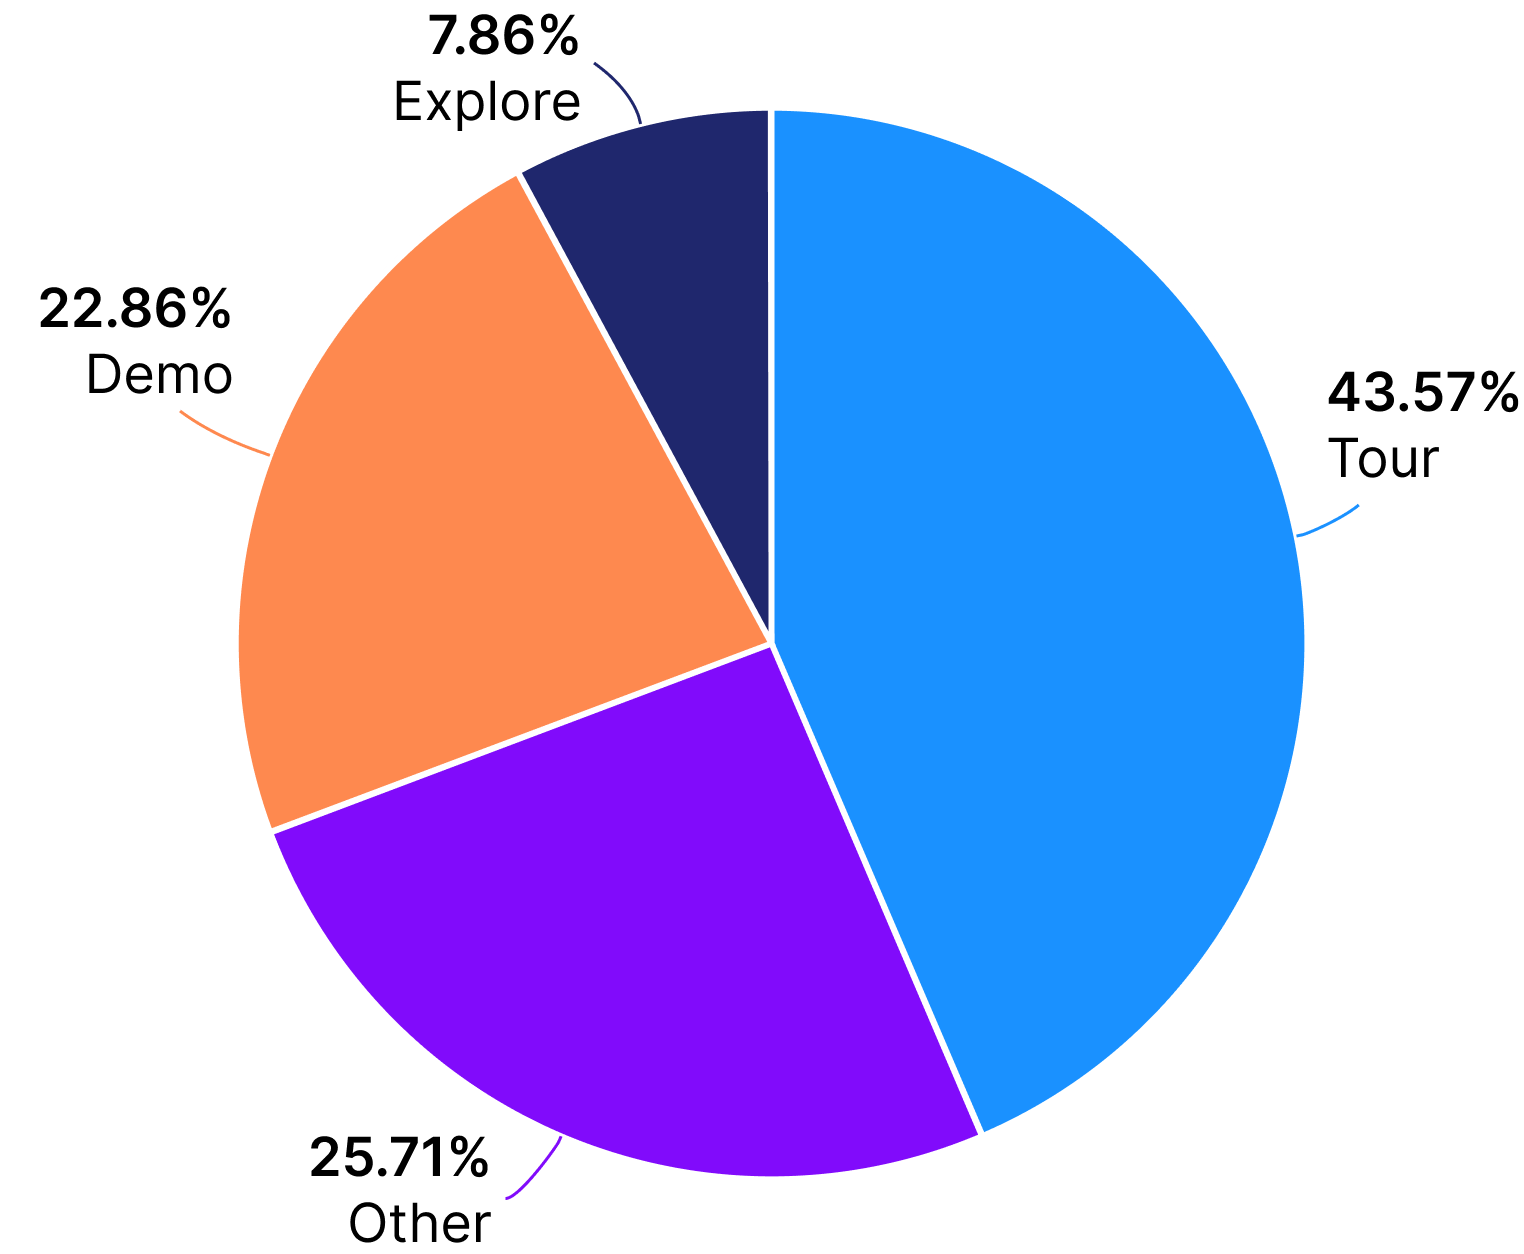
Top use cases throughout the funnel
To uncover a complete breakdown of customer use cases, we looked into the top ways our customers are using interactive demos.
How to Optimize your Interactive Demo
For this section, we analyzed 200+ interactive demos with the highest regular traffic and visitor conversion. These demos are mostly public-facing on a company website or in marketing campaigns.
These included both gated (included a form upfront) and ungated (did not include a form) interactive product demos.
Demo completion and length data
Completion rate shows how far a visitor made it through an interactive demo. For this report, we measured the completion rate by:
Total number of completed demo sessions / total number of started demo sessions
In-platform analytics will show how many users complete each step of your demo. Look out for big drop-off points as this may indicate that a section needs to be condensed, removed, or is confusing to viewers.
Data Note: For this section, we looked at the completion rate for the first section of each demo. Some of the demos may include multiple sections to highlight different use cases or features.


Demo length tips
- Keep the introduction of your demos short to hook visitors in. Tell a story of your product's value instead of highlighting every feature.
- If your demo is longer than 20 steps - organize it with a checklist or demo library so users can choose the sections of your product they are most interested in exploring. Demos with a checklist had on average a 17% higher completion rate.
Conversion and CTAs data
Conversion rate indicates how many visitors are clicking a call-to-action ("CTA") within the demo itself. For this report, we measured conversion rate by:
Total number of CTA clicks / total number of demo sessions
One demo can include multiple opportunities to convert and multiple types of CTAs. For optimal CTA placement, we looked at how many times a CTA was clicked depending on its step location in the demo.
Data Note: Demo landing pages may include CTAs outside the demo. Conversion rates may be affected if there are additional CTAs surrounding the demo.


Conversion tips
- Include a CTA around step 7 and step 15. The most CTA clicks across all demos occurred at these steps.
- On each CTA step, include two options. For example, "Continue Demo" and an option to convert.
Gated vs ungated data
Across all public-facing marketing use cases demos, we analyzed the breakdown of gating (using a form at the beginning of the demo) vs ungating (no form at the beginning of the demo).
Generally, gating vs ungating depends on the interactive demo use case. For example, an embedded demo on a product page is likely to be ungated since it is replacing an image or video.
Data Note: Some demos did have forms later in the demo (after the first section). For this report, we included that under ungated since a portion of the demo was still ungated for users to interact with.

Gating vs ungating tips
- If you are using a demo to direct traffic to your primary website CTA, we recommend an ungated demo to provide immediate value to visitors and boost overall site conversion.
- If you are using demos to gather leads, we recommend adding a short form with one to two fields. 90% of demos with a form have only one to two fields.
How to Promote your Interactive Demo
For this section, we again analyzed our top-performing, public-facing demos.
To optimize demos, we looked at the most popular CTA types, embed types, and optimal landing page positioning to increase demo engagement rate.
Below covers best practices when promoting your interactive demo on a website or in a marketing campaign.
Website CTA data
A majority of interactive demos on a landing page are linked out via a primary or secondary CTA. For this section, we reviewed customer websites with a demo embedded or linked out from their landing page.
When analyzing embedded demos, we looked at if they were full-screen embedded (taking up the entire browser width) or embedded within part of a landing page.
Data Note: Data is only for public landing pages, this does not include demos sent in one-to-one communications or through a link.
Website CTA tips
- If you want to best replicate the experience of your application, link out to a full-screen embed of your interactive demo. Include a clear primary or secondary CTA on your homepage or in your navbar.
- If you want to include additional text or CTAs surrounding the demo, partially embed it on a landing page. If you want to embed multiple demos on a page consider a demo library.
Landing page placement data
Engagement rate indicates how many landing page visitors interact with your interactive demo. For this report, we measured engagement rate by:
Total number of sessions with a completed step 1 of an embedded demo / total number of sessions on a landing page with an embedded demo
Data Note: For this section, we looked at ungated demos embedded within a landing page.

Landing page placement tips
1. Embed the demo higher on the page (above the fold) to make sure users engage with your interactive demo.
2. If you embed the demo lower on a landing page, use a scroll CTA above the fold so visitors can quickly access your demo.
Key Interactive Demo Takeaways
1. Interactive demos' popularity has significantly grown over the last two years. Almost 5% of our sample size of SaaS websites had an interactive demo or product tour CTA. The most common use case for our customers for an interactive demo is a public, ungated website demo.
2. Shorter value-focused demos have higher completion and conversion rates than very long demos. We recommend keeping the first demo section around 10 - 15 steps and then letting your users choose what features they want to explore next. Include multiple CTAs throughout your demo (most commonly at step 7 and 15).
3. A majority of customers link full-screen to their demo from a website CTA (most commonly with “Product Tour” as the CTA). If you embed within a landing page, we recommend embedding higher up on the landing page or including a scroll CTA to maximize engagement.
Turn demos into deals.
Build interactive product demos that engage buyers and close deals faster.